 Top User Level of CDB
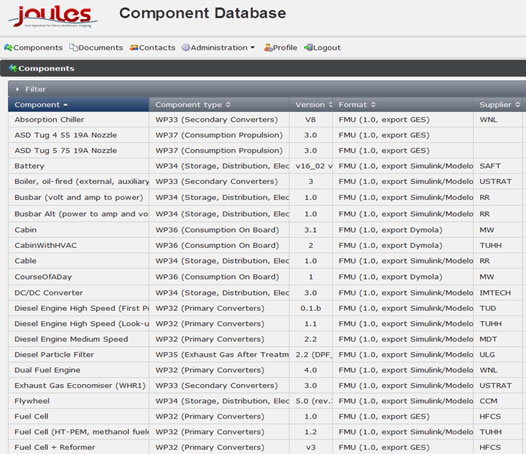
Component Database
The JOULES Component Database (CDB) is one of the key results of the JOULES project. It serves as a central web-based CDB for two main purposes:
- Provide simulation component models based on FMI-standard for ship's energy grid simulation
- Storage of the fuel table as consistent link between energy grid simulation and LCP-Assessment
A big number of component models have been developed and are stored in the component database. The FMI-standard allows for easy exchange between model providers and end-users for integration in ship's energy grid. The Figure below provides a screenshot from this newly developed CDB.
External Costs
External costs from harmful emissions
Extensive research supported by EU-funding has been carried out the last decade and valuable information is now on hand for practical use also in the maritime industry. A consolidated and updated handbook for internalisation of external costs in transport has been published (Ricardo-AEA 2014) and the following Figure is taken from that report. All values are given in €/t of emission.
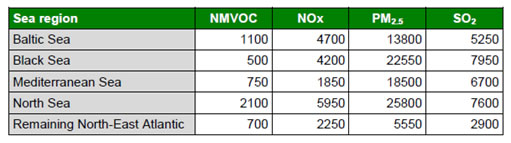 Source: NEEDS (Preiss et al. 2008), updated to year 2010 using EU
nominal GDP per capita (PPP) figures.
Source: NEEDS (Preiss et al. 2008), updated to year 2010 using EU
nominal GDP per capita (PPP) figures.All values are rounded.
These costs mainly cover damages to health of human beings and therefore, the values differ from region to region depending on the maritime traffic, prevailing wind directions and how densely populated areas are which suffer from the emissions. Damages to nature (increased eutrophication of e. g. the Baltic Sea, acidification and loss of biodiversity in general) are very difficult to monetise and are therefore excluded from a. m. values.
Climate Costs resulting from GHG emissions
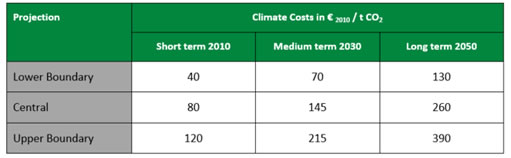
Regarding the quantification of costs to repair damages from the release of GHG-emissions, an ongoing debate with one of the most prominent reports being the Stern Report (Stern 2006) is evident. The German Federal Environmental Agency has scrutinized a number of different reports and offered a best practice approach according the table below for addressing climate costs e. g. in research studies (UBA 2014).
 Climate Costs
This best practice estimation is a combination of a damage cost approach and marginal abatement cost approach. Both approaches have their pro and cons and having considered them carefully, a. m. values have been published by the German Federal Environmental Agency (Umweltbundesamt UBA). They include a time preference of 1% and a European equity weighting in order to address the "polluter pays" principle. In research studies, it is recommended also to consider the bandwidth as given in a.m. table and this also supports the sensitivity analysis as done exemplary for some application cases in JOULES.
The latest up-date of damage costs from CO2-emissions is given in (Ricardo-AEA, 2014) and they are slightly deviating from the UBA approach. The UBA best practice estimation has been chosen in the JOULES project as it also reflects lower and upper boundaries in order to be able to perform sensitivity analysis using these lower and upper limits.
Fuel Table
The Fuel Table as developed in JOULES contains about 35 fuels for maritime applications providing data for:
- Physical properties
- Chemical properties
- Production Data from Well to Tank (GWP, Expended Energy, NOx, SOx and PM)
- Price Projections
The Fuel Table serves for the purpose to use fuel data in the energy grid simulation of application cases (stored as Fuel FMI) and in LCP-Assessment consistently. The Figure below highlights some examples from the fuel table and displays the key drivers for the integrated environmental and economic assessment.
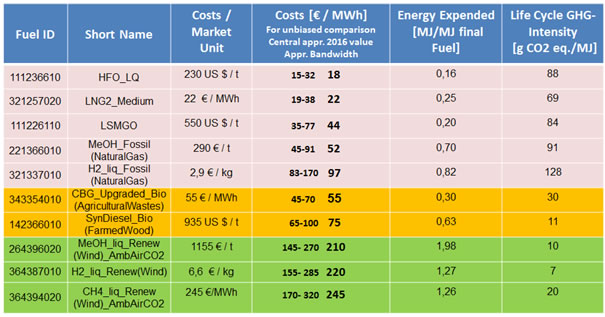 Example for some fuels and key information as stored in the Fuel
Table/approximate cost estimation for bio-fuels and e-fuels (green)
at 2016 level
Example for some fuels and key information as stored in the Fuel
Table/approximate cost estimation for bio-fuels and e-fuels (green)
at 2016 level
The following typical kinds of fuels are stored with corresponding information:
- Fossil fuels as used today in maritime industry (pink)
- Bio fuels (like Diesel or Methanol) and Upgraded Bio Gas from renewable agricultural feedstock like farmed wood or agricultural waste (orange)
- Electro-Fuels with different pathways for production (mainly different sources of electrical energy, GHG sources, central or local production (green))
The projections for the JOULES project are based on the assumption that HFO and MGO prices correlate to crude oil prices. For the HFO, MGO, and LNG projections, the EIA projections (EIA 2015) assumed a scenario of low economic growth, with moderate/high regulatory and stakeholder pressure according scenario "C" in (DNV GL 2015). In a similar way, a price projection for Methanol from natural gas as feedstock has been achieved.
The price projection for electro-fuels has been based on an approach using specific costs [€/kWh] as given in the literature for:
- Production of renewable energy from wind farms [1]
- Hydrogen Production
- CO2-extraction (from flue gas of existing industries or from ambient air)
- Synthesis costs (Methanation, Methanol Synthesis, Fischer-Tropsch Synthesis)
- Liquefaction where applicable (liquefied Re-methane to substitute LNG, Re-Hydrogen)
- Storage and Distribution covering the infrastructure costs
- Bunkering costs
Considering that future development of such fuels must take place to achieve the emission reduction targets, it is well known that scale effects, efficiency gains and improved utilisation of these future fuel production plants allow for a significant reduction of the production costs (represented in terms of learning curves). In the context of the JOULES project a linear drop of 50% by 2050 has thus been assumed due to a. m. effects using a 500 MW plant for production of e-Methanol as an example (similar to Taljegaard et.al. 2015).
It must be clearly stated that such electro-fuels based on hydrocarbons are only sustainable (or GHG neutral), if the CO2 as feedstock has been extracted from the atmosphere first. Therefore, this technology [2] is expected to be of outmost importance to achieve the ambitious GHG-reduction targets in the future including the required contribution of shipping. However, as an intermediate step, e-fuels produced from CO2 of flue gases are welcome to be used as to at least reuse the once released CO2 from fossil fuels in a second production step, also known as Carbon Capture and Usage (CCU). An example already under way for commercialisation can be studied at Carbon Recycling International's website (CRI 2016).
Alternatively, a CO2 circular economy for shipping using intermediate Carbon Capture and Storage (CCS) on board bigger ships and to reuse the CO2 again as feedstock in the production process of electro fuels could be in principle possible. However, the implications of such CCS-Systems on board and storage requirements of liquefied CO2 (due to space requirements) on board ships are multiple and could be considered in a separate systemic investigation.
The RCP2.6 Scenario (limiting and stabilizing the temperature increase below 2°C) as presented in the 5 th IPCC Assessment Report anticipates a larger amount of bio-energy together with CCS technology to provide net negative emissions with the use of such bio-energy (e. g. fuels as mentioned above in Figure 12). The core question is, whether sufficient bio-energy not conflicting with food production or relying on deforestation can be made available in the future also on the long run. Due to the charged atmosphere of the ongoing discussion, the JOULES consortium proposes the pathways via electro-fuels to be more attractive on the long run.
[1] Wind Power as an example, also Concentrated Solar
Power (CSP) power plants, Photovoltaik (PV) power plants, wave or
tidal power plants are expected to contribute to sufficient renewable
energy in the future.
[2] Anyhow, this carbon
capture technology is urgently needed from 2080 on to reduce
GHG-emissions from the atmosphere as shown in Figure 2. How the
captured GHG can then be ultimately stored for many generations is
another highly technical and societal sensible issue.
